Aircraft Engine Performance Analysis
at Rolls-Royce ca. 1940
by Robert J. Raymond
Published March 2011


Abstract

Engine testing and performance modeling to quantify engine and supercharger air flow characteristics in support of Rolls-Royce Merlin development began in the late 1930s. The status of this work was summarized in an internal Rolls-Royce Report in March, 1941 and made public by the Rolls-Royce Heritage Trust in 1997.

This paper introduces a generalized method of predicting and comparing aircraft engine performance under flight conditions. Information in the Rolls-Royce Report is analyzed in this generalized manner, allowing comparison of Merlin and Allison V-1710 performance, which helps validate the method.

Data from the Rolls-Royce Report is reconciled with other available data to conclude:

V-1710 volumetric efficiency was somewhat higher than the Merlin's and is readily explained by differences in valve timing, intake passage design, and compression ratio;

An error exists in the method for determining Merlin friction and pumping characteristics described by Stanley Hooker in his autobiography;

Friction and pumping characteristics of the Merlin and V-1710 are similar;

Supercharger performance of the ca 1941 Merlin XX is similar to that of the ca 1943 Wright.

Readers uninterested in the engineering may proceed directly to Summary and Conclusions.


Preface

By the end of summer, 1940, the Battle of Britain was over, the victors having flown Spitfires and Hurricanes powered by the Rolls-Royce Merlin engine. The vast majority of these engines were equipped with single stage and single speed superchargers, which would soon be replaced by more advanced marks including two speed, two stage superchargers with aftercooling. These developments allowed the aircraft they powered to maintain a crucial advantage over the German aircraft they were fighting throughout World War II despite the fact that their opponent’s engines were significantly larger in displacement. The testing at Rolls-Royce in support of these developments began in the late 1930s and involved establishing the air flow characteristics of the engine and supercharger. The status of this work as of March, 1941 is summarized in an internal Rolls-Royce report titled “The Performance of a Supercharged Aero Engine” by Stanley Hooker, Harry Reed and Alan Yarker [1] and was made available to the public in 1997 by the Rolls-Royce Heritage Trust. This report makes no mention of it, but the design of a two stage supercharger had begun a year before the report was written and it is obvious that the work described was at least partially in support of two stage supercharger development. The authors state that their motivation was to better characterize the performance of their engine at altitude so as to minimize arguments between engine and airframe builder as to why the performance of new or modified aircraft did not meet expectations. This is a valid reason for the work but would seem to be somewhat secondary given the military situation in 1941 when the outcome of the conflict was still uncertain and superior performance at high altitude was a life or death issue. I would guess that their primary goal was to get more power at altitude and settling arguments with Hawker and Supermarine was rather secondary.

The object of this paper is to analyze the information in the Rolls-Royce report and present it in a more generalized manner. This will allow the comparison of Merlin performance with that of the Allison V-1710, which while dimensionally similar to the Merlin had significantly different intake manifold and cylinder head intake passage designs. A second document, Sir Stanley Hooker’s autobiography Not Much of an Engineer [2], contains an appendix that outlines the 1941 report and adds the results of some additional analysis carried out in an attempt to infer the Merlin’s friction and pumping characteristics; information that also allows comparison with the V-1710. Hooker’s discussion also makes clear that the goal was superior performance at altitude stating “these gains came at a time in the war when the odd extra thousand feet and extra speed meant the difference between death to the enemy fighter or death to the Spitfire”. Beyond comparing some of the performance characteristics of the Merlin and V-1710, my motivation is to provide data and validation for a technique I am developing for predicting aircraft engine performance under flight conditions. The data in the Rolls-Royce report on breathing and supercharger performance is very valuable in this respect. Indicated horsepower (the power delivered to the piston), besides determining how much power gets to the propeller, influences bearing loads, thermal loading of the piston and cylinder head and detonation limits of the engine. The ability to estimate indicated horsepower is, therefore, important for all aspects of engine analysis and the two documents analyzed here contribute significantly to this effort.

Nomenclature

a – speed of sound
CP – specific heat at constant pressure
eV – volumetric efficiency
F – fuel/air ratio
k – ratio of specific heats
Mi – mass of fresh charge ingested per cycle
mep – mean effective pressure
N – engine speed
pi – intake manifold pressure
pe – exhaust manifold pressure
pa – atmospheric pressure
PR – pressure ratio across the supercharger
Qc – heating value of fuel
R – Universal gas constant
r – compression ratio

s – piston speed
Ti – intake manifold temperature
Ta – ambient temperature
ΔTc – temperature rise across the supercharger
U – impellor tip speed
V – engine ( or cylinder ) displacement
– charge flow, air plus fuel
– fuel flow
– air flow
– choking mass flow

ηc – Adiabatic efficiency
ηgB – Gearbox efficiency (0.95 for Merlin XX)
ηi – Indicated engine efficiency

Introduction

Predicting the output of a piston engine rests on thermodynamic and fluid mechanic principles combined with experimental data taken in as general a manner as possible. Thermodynamics can set a limit to the indicated efficiency (the efficiency with which the heat released by the fuel is converted to work on the piston) based on the compression ratio and the fuel/air ratio; but how close can a real engine approach that limit? The same reasoning applies to the supercharger; none are 100% efficient. When it comes to frictional and pumping losses, one is even more dependent on experimental data. In the subject report the Rolls-Royce engineers were not attempting, at least at the time the report was written, to determine indicated, friction or pumping horsepower. In general, to get the brake horsepower (BHP, the power to the propeller) one must determine the indicated horsepower (IHP) and subtract the compressor (supercharger) (CHP), friction (FHP) and pumping (PHP, getting charge in and out of the cylinder) powers, as follows:

We can re-arrange this equation to illustrate how the Rolls engineers attacked this problem,

Rolls-Royce defined a shaft horsepower as follows:

Since the charge flow is equal to the air flow plus fuel flow the following relationship is easily derived:

Rolls-Royce engineers then carried out a series of tests at various speeds and manifold pressures to vary the charge flow. They measured the brake horsepower and calculated the supercharger power at each point. The sum of these two divided by the charge flow is the left side of Equation (3), above. The results were then plotted against charge flow rate and are shown as Figure 13 in their report for five engine speeds. I have plotted the same results from their Table I in Chart 1 for one engine speed. This indicates that the technique works well since the data is from two different supercharger gear ratios. A look at the right side of Equation (3) will indicate what is going on. I have substituted the first law expression for indicated efficiency for the indicated horsepower in the first term that eliminates its dependence on the charge flow rate so as long as the fuel/air ratio stays constant, and Table I [1] indicates that it did, and if the spark advance was reasonably optimal then this term would not vary as the charge flow was reduced. The second term would become larger as the charge flow is reduced since the friction horsepower would remain constant at a constant rpm and the pumping power would increase slightly as the manifold pressure was reduced. This is why the curve shown in Chart 1 drops off sharply as the power is reduced. With this technique established what remained was to develop a method for predicting the charge flow under all conditions of engine speed, intake and exhaust manifold pressures, and ambient temperatures. How this was accomplished will be described in the following section. The Rolls-Royce technique for predicting air flow will be examined and generalized to a volumetric efficiency so that it can be compared on a one-to-one basis with the V-1710 and I will attempt to explain the differences on the basis of design differences between the two engines. The friction and pumping loss characteristics of the V-1710 will be presented and discussed with reference to an attempt at the same for the Merlin as described by Hooker [2]. Supercharger performance data presented in Hooker, et.al. [1] will be analyzed in a manner that will allow comparison with a Wright supercharger of ca. 1945. Finally, I will compare my predicted performance of the Merlin with the test results and predictions of Rolls-Royce and Hawker.


Air Flow / Volumetric Efficiency

Rolls-Royce engineers began the process of characterizing the air flow of the Merlin by examining the intake stroke and developing a relationship between the mass of air ingested per cycle and the operating variables i.e., manifold pressure, exhaust pressure, manifold temperature, etc., that resulted in the following relationship:

In this equation ΔT is the heat picked up due to heat transfer between the hot engine parts and the incoming charge. This relationship is not based on a rigorous thermodynamic analysis of the intake process. A more rigorous expression based on the same assumptions the Rolls engineers made, i.e., no valve losses, and cylinder pressures at top and bottom dead center equal to exhaust manifold and intake manifold pressures respectively is given in Equation (5) (see Reference [4], Appendix IV).

These equations give the same result when pe = pi but diverge considerably as pe / pi decreases, e.g. at pe / pi = 0.6 the expression in brackets for Equation (4) gives 1.08 while for Equation (5) it is 1.056.

A more general and useful way to characterize the air flow is to define a volumetric efficiency as follows:

Comparing this expression with Equations (4) and (5) reveals that the portions of those two equations in brackets is the definition of volumetric efficiency when ΔT is zero. Volumetric efficiency is simply the fraction of fresh charge that is in the cylinder when the intake valve closes as compared to the cylinder displacement being filled with a charge at manifold density. Instead of defining an efficiency as in Equation (6) the Rolls engineers simply used the test data to calculate a ΔT in Equation (4) resulting in their Figure 11, (ref. [1], or Figure 2 in ref. [2], which shows Ti + ΔT plotted against manifold temperature. All it amounts to is another way of defining the loss factor (volumetric efficiency) and will give the same result in the end.

The important thing here is in recognizing which variables were critical in completely characterizing the flow rate under all possible operating conditions when maximum power was called for. It is not apparent from their report whether or not Rolls engineers resorted to dimensional analysis to determine what variables they needed to examine. For example, did they realize that the ratio of exhaust to intake manifold pressure was sufficient to characterize the flow and it was not necessary to test at exhaust pressures below sea level pressure? Taylor [4] gives a dimensional analysis of the intake process and validates it with experimental results that indicate the Rolls-Royce testing covered the range of variables necessary to characterize the air flow of the Merlin.

One of the most important variables, one often ignored in its effect on volumetric efficiency, is the manifold temperature. Rolls engineers recognized its importance and tested with a wide range of supercharger gear ratios that gave a good-sized variation in temperature since the temperature rise goes as the square of the impeller tip speed. The data contained in the Rolls report is, as far as I am aware, the only information available for supercharged, liquid cooled aircraft engines. The NACA has characterized the effect of manifold temperature on flow rate for some air-cooled aircraft engines but none of their testing of the V-1710 or the V-1650 (Packard Merlin) that I’m aware of includes the effect of manifold temperature on volumetric efficiency. Defining a manifold temperature on which to base volumetric efficiency is somewhat problematical in a gasoline engine due to the lack of steady state conditions in the manifold. The fuel is typically not completely evaporated and the flow is not steady. Rolls engineers chose to base the manifold temperature on the temperature rise across the compressor as given by the expression in Chart 2.

Also shown in Chart 2 is the expression used by the NACA [5]. The Rolls expression contains the constant, 25ºC, which represents the temperature drop due to complete evaporation of the fuel while the NACA expression contains the fuel/air ratio as a variable. The NACA expression is based on a wide variety of engine tests that indicate the well known fact that fuel is typically not completely evaporated in the manifold. The 390 F term in their expression implies that about 66% of the fuel is evaporated some distance downstream of the supercharger.

Chart 3 shows how the volumetric efficiency varies with manifold temperature in the Merlin XX at 3,000 rpm and 50 inHgA manifold pressure. The data for Chart 3 was taken from Figures 5 through 10 of the Rolls report [1]. The slope of the line in Chart 3 does not appear to change too much with speed and manifold pressure but there is more scatter in the data at lower speeds and manifold pressures and I have shown only one set of results here.


With this as background we are now able to compare the volumetric efficiency of the Merlin XX with the V-1710. Data from Table I of the Rolls report was used to calculate the volumetric efficiency of the Merlin at both supercharger gear ratios and corrected to the manifold temperature calculated for the Merlin XX running with the 9.49 gear ratio (271ºF). Volumetric efficiency is in this instance based on air flow, not total charge flow. This is shown in Chart 4 versus exhaust to intake pressure ratio at a speed of 3,000 rpm. Note that the 8.15 and 9.49 data fall on the same line. If the temperature correction had not been made the lower speed gear ratio data would have fallen about 2 to 3 points lower than the higher gear ratio. The data point at a pressure ratio of about 1.2 and a volumetric efficiency of 0.93 is well off the line and represents the point at 25.45 inHgA in Table I [1].

When this data point is plotted on that report’s Figure 11 the calculated charge temperature is similarly off their curve.

Chart 4 also shows data for the V-1710 taken from Reference [6]. These data points are also corrected to 271ºF, which implies the assumption that the volumetric efficiency versus manifold temperature of the V-1710 is as shown in Chart 3 for the Merlin. Data from [6] indicates that the slight difference in fuel/air ratio would not have a measurable effect on volumetric efficiency. The curves of Chart 4 indicate that, at full power, the volumetric efficiency of the V-1710 was 2 to 3 points higher than that of the Merlin XX.


Charts 5 and 6 show sectional drawings of the Merlin and Allison V-1710. To explain the differences shown in Chart 4 we need to examine the intake system designs of the two engines, the valve timing, and the effect of the difference in compression ratio of the two engines. Reference [3] has shown that the intake valve losses of the two engines are estimated to be the same. Charts 5 and 6 show significant differences in intake runner length and the difference in valve overlap is indicated in Chart 4. Table 1 shows the effect of these three variables at a pressure ratio of 0.75 and 3,000 rpm. The effect of the lower compression ratio works to the advantage of the Merlin at pressure ratios lower than one, as Equation (5) would indicate, and the higher ratio of the Allison works to its disadvantage at pressure ratios higher than one as Chart 4 shows.

The longer runner length of the Allison gives a little over one point improvement in volumetric efficiency and its increased valve overlap adds another 3 points. It is clear from Table1 that if the Merlin had had the same compression ratio, runner length and valve overlap as the Allison V-1710 it would have had the same or slightly better volumetric efficiency as that engine. The effect of runner length was estimated using data from [7] and that of the valve overlap from [4].

The difference in valve overlap between the two engines is interesting to think about. Why did Rolls use such a low overlap when the advantages of the higher value seem rather obvious? At full power at 20,000 feet the Allison overlap might have resulted in a very slight amount of loss of unburned charge but the amount of time at that condition would have resulted in a negligible impact on fuel consumption. The exhaust to intake pressure ratio at cruise would not have resulted in any significant loss of fuel due to valve overlap, and the higher volumetric efficiency would have lowered the supercharger speed requirement and resulted in slightly lower fuel consumption. An increase in valve event, which an increase in overlap would imply, would have made the dynamics of getting the valves opened and closed easier, resulting in lower cam and follower stresses.


Friction and Pumping

The friction and pumping characteristics of the Merlin XX were calibrated into the procedure outlined in the Introduction as represented in Chart 1 and described by Equation (3). Rolls engineers assumed the “mechanical efficiency” of the engine would not change with altitude since the coolant and oil temperatures would be maintained at sea level conditions where the calibration tests were made. This is a good assumption for the mechanical friction but not so good for the pumping since the exhaust pressure is lower at higher altitudes. It is interesting that they never considered the pumping and mechanical friction separately but since they were mainly interested in performance at high manifold pressures this did not result in much of an error as will be shown later.

The outline of the Rolls report given in an appendix of Hooker’s autobiography [2] contains an additional piece of data not mentioned in the original report, and it is not clear when the tests described were performed (if in fact there was additional testing) or how this information was subsequently used. Rather than the calibration procedure represented by Chart 1 Hooker calculates an indicated horsepower based on friction and pumping power obtained from extrapolating a curve of brake horsepower vs. charge flow back to zero charge flow as shown in Chart 7, which I re-plotted from the data in Table I of the Rolls report.

This curve is known as a Willans line and was principally used to determine the frictional horsepower of naturally aspirated Diesel engines. This is the only instance I know of where this technique was used on a supercharged spark ignition engine. I have shown the intercept as a negative 210 horsepower at 3,000 rpm, which, to me, indicates Hooker probably used this data as well. He makes the further assumption that this friction power varies as the square of engine speed. He is basically using Equation (1) instead of Equation (3) as given in the Introduction. The problem is he uses 210 horsepower for the combined (FHP+PHP) at all 3,000 rpm operating conditions and combines it with the brake and supercharger powers of Table I to get a plot of indicated horsepower vs. charge flow. Hooker interprets this as a straight line and defines the following relationship:

Since (according to Figures 5 - 10 of the Rolls report), the charge flow goes to zero at 5 inHgA intake manifold pressure, the pumping portion of that 210 horsepower had to have been more than 77 horsepower if, in fact, the intake manifold pressure would have reached that level at the point where the charge flow would have been zero. If that were the case, then the pumping mep (assuming no valving losses) would have been 30 – 5 = 25 inHgA or 12.3 psi, at least, which is about 77 horsepower for the Merlin at 3,000 rpm. This is obviously too high at high manifold pressures where the pumping power can actually become positive.

Another way of showing that Equation (7) is not plausible is to examine what it implies about indicated efficiency. This is shown in Table 2. Equation (7) implies that the indicated efficiency of the Merlin XX was 97% of the theoretical fuel/air cycle efficiency for the compression ratio and fuel/air ratio at which the engine was operating. The usual figure for a water cooled engine is in the 85% range while the best figure I am aware of is for an air cooled Wright cylinder at 90%. Since Hooker’s method simply adds a number to the data already taken and then subtracts it out again to get a brake horse power at some other condition he hasn’t introduced much error into the process. I can only speculate that Hooker thought his later method was more understandable and substituted it for the procedure actually used as outlined in the Introduction.

What I am really interested in is the question of the real friction and pumping characteristics of the Merlin vs. the Allison V-1710. Since the friction and pumping characteristics of the V-1710 are known [8] my approach will be to apply these to the Merlin and see if the resulting performance makes sense. I will revert to mean effective pressure rather than horsepower since it is more meaningful in a general way and eliminates engine size from the analysis. For readers unfamiliar with the concept, see Reference [3], Appendix [1] or any internal combustion engine text.


At 3,000 rpm Chart 8 indicates the mechanical friction mep of the V-1710 is 22.7 psi. and Chart 9 at a ratio of pe / pi of 0.6 indicates a ratio of pumping mep to intake manifold pressure near zero. Hooker’s extrapolation of 210 hp or 33.6 psi is probably much too high for reasons already discussed but is close to the sum of friction and pumping for the V-1710 when the intake and exhaust manifold pressures are equal at 30.0 inHgA (see Chart 10).

In an attempt to evaluate the differences in design between the Merlin XX and the V-1710 I used Bishop’s technique [9] to investigate the differences in mechanical friction due to the differences in piston skirt area, number of piston rings and the difference in crankshaft bearing sizes of the two engines. The result is shown in Table 3.

The piston skirt areas of the two engines is almost identical and the extra piston ring of the Merlin XX exactly balances the friction increase of the larger crankshaft bearings and larger valve gear of the V-1710. There would appear to be no reason to expect that the friction and pumping of these two engines would be much different. The performance predictions to be described in a following section appear to bear out this conclusion. It is interesting to note that the NACA used a single relationship to describe the friction characteristics of all high output piston engines both air and water cooled in their performance analyses and claimed it was based on extensive testing but I have never found any NACA reports that would substantiate that claim. Their relationship tracks the V-1710 data to within a psi up to about 1,800 rpm at which point the

V-1710 increases more rapidly until, at 3,000 rpm, its mep is about 4 psi higher.


Supercharger Performance

Calculating the power to drive a supercharger can be approached in two ways; by calculating the change in angular momentum of the air entering and leaving, which, through Newton’s second law, gives the required torque, or through the application of the first and second laws of thermodynamics. The equation for temperature rise through the supercharger used for Chart 2 is derived from the first of these. The power to drive the supercharger is the product of temperature rise and mass flow rate. An expressions for the power based on the laws of thermodynamics is:

We can see from the above expression that the two equations for temperature rise do not look, at first glance, to be much alike. The reason to use the momentum equation (from Chart 2) is that it gives a reasonable result without having to go to a performance map (if there is one) and an inevitable iteration process.

Figure 23 of the Rolls report is the only place in that document where adiabatic efficiency data is presented. Since our goal is to see where the Merlin’s supercharger performance stood with respect to a Wright machine of some five years later, all of the following analysis is based on this one set of data shown here as Chart 11.

The first thing to notice is that the temperature rise is not constant at a constant impeller tip speed in spite of the momentum expression. If one looks at the data of Chart 11 both ways, the momentum equation and the thermodynamic relations agree well at the lower air flow rates giving the same horsepower but diverge as flow rate increases so that at a flow rate of 260 lb/min the momentum relationship gives a result about 8% higher. The measured values agree perfectly with the thermodynamic relationships when the adiabatic efficiencies shown in Chart 11 are used to calculate the horsepower since that is how they were derived in the first place.

The next step is to relate Merlin supercharger performance to that of the Wright machine whose performance is shown in Chart 12.

There are two test methods involved here which must be reconciled. The first is in the definition of the efficiency; in the case of the Wright tests the pressure ratio is based on total to total (discharge to intake) whereas the Merlin performance is based on static to total. The second problem is that the Wright tests were carried out in a procedure standardized by the NACA [11] where the intake and discharge pipes are straight (one for the intake and, in this case, nine for the discharge) while the Merlin supercharger was tested with its stock inlet and discharge elbows in place.

The first of these differences was handled by simply estimating the intake manifold diameter from engine layouts and using the calculated compressor discharge conditions to get the velocity head and total pressure. The differences in intake and discharge configuration were approached by estimating the pressure drop due to the two elbows at each operating point and correcting the pressures accordingly. This leaves only the effect of the intake elbow on the flow pattern entering the supercharger and the consequent effect on the adiabatic efficiency unaccounted for. We know this was important because Hooker would shortly re-design the elbow to good effect. In any case, these are the two factors I took into account when comparing the performance of the two superchargers.

Chart 12 compares this performance in a dimensionless manner which is different from the dimensionless approach used by the Rolls engineers in their subsequent analysis [1]. Their abscissa is not really dimensionless

and consequently doesn’t allow comparing machines of two different impeller diameters, which is the case here. I have chosen to use an abscissa that has a simple physical interpretation: it is the mass flow divided by the choked mass flow through an area defined by the outside diameter of the impeller with the same inlet pressure and temperature and sub-critical discharge. Also shown are lines of constant impeller tip Mach number ( u/a) and lines of constant adiabatic efficiency.

It would appear from Chart 12 that the efficiencies of the two superchargers were not all that much different. The Merlin supercharger’s efficiency would appear to drop faster with increasing flow rate than the Wright’s but the surge lines have the same slope. It’s unfortunate that there is no data for the Merlin supercharger at lower tip speeds so that peak efficiencies could be compared.

Schlaifer [12] refers to tests of the Merlin XX supercharger performed at Wright Field carried out “according to the NACA standard procedure”, which presumably means without the inlet and discharge elbows but in another footnote says the efficiencies include inlet losses. In both cases the efficiency is given as 68% at a pressure ratio of 2.2/2.3 to 1. He also reports an efficiency of 67% at 2.9 to 1. This is considerably lower than my corrected efficiency of 76% at that ratio (see Chart 12) and lower than the 72% value attained on test at Rolls-Royce (see Chart 11). Schlaifer also presents a graph of supercharger performance vs. pressure ratio for Wright, which shows improvement in efficiency from 1935 to 1943. When superimposed on this graph the Wright Field data indicates that the Merlin XX supercharger gave about the same performance as the 1940 Cyclone production unit whereas my analysis shows it closer to the 1943 R-3350 production unit. We know things were changing very rapidly in the area of supercharger design in this period and it may be that the unit tested at Wright Field was not as advanced as the one used in the tests reported in the March 1941 report. Seeing the Wright Field test report might go a long way to explaining these differences.


Performance Predictions

The technique used by Rolls to predict performance was described in the Introduction. It is interesting to note that, at least in the 1941 report, they did not use their better understanding of supercharger performance to calculate supercharger power in their altitude predictions but, instead, stuck with the simpler technique using the momentum relationship. Since the unit was always operating near its maximum efficiency for the cases they were interested in this was not a bad choice. As I pointed out, their engine was basically calibrated on the test stand and they made the assumption that the friction and pumping would not change with altitude, which wasn’t a bad assumption as long as the intake manifold pressure was significantly higher than the exhaust manifold pressure.

Since the calibration was done with more than one supercharger gear ratio, they were able to verify that their method of calculating supercharger power let all of the data at a constant speed fall on a single curve (see Chart 1).

Without a calibrated engine one must start by predicting the indicated power. This requires knowing the compression ratio and fuel/air ratio, the two variables that set a limit to the indicated efficiency. The value of one other variable is needed, the volumetric efficiency, which in this case we can get from Chart 4. The only assumption we need to make is the ratio of the actual indicated efficiency to that set by the thermodynamic characteristics of the constant volume Otto cycle. This ratio is usually in the range of 0.85 to 0.90 for well developed engines. The 0.90 value is the highest I have seen and was achieved on a Wright air-cooled cylinder [13]. The heat losses are less for an air-cooled cylinder, which probably explains the higher value. In the present cases we are interested in predicting the brake horsepower for a given manifold pressure so that leaves only the manifold temperature required to get the indicated power (see Equation (6)) since the air flow and therefore the fuel flow are now established.

Since I intend to use the Rolls-Royce supercharger performance (Chart 12) to get the supercharger power, the manifold temperature is a function of where we are on that map. This involves a guess at the operating condition and then a little iteration to arrive at a refined value since the manifold temperature has an effect on the volumetric efficiency of the engine (see
Chart 3). Now we have both indicated and supercharger horsepowers and all that remains is to determine the friction and pumping powers.

Our prior analysis has indicated that Hooker’s use of the Willans line gave a figure for the sum of friction and pumping, which implies an indicated efficiency that is implausibly high. This is because he didn’t account for the much higher pumping losses the data and assumptions would imply at zero charge flow and which would be much reduced at high manifold pressures. I will use the Allison V-1710 friction and pumping characteristics as given in Figures 8 through 10 for the Merlin XX for reasons outlined in the section on friction and pumping. I have chosen two cases from the Rolls report to compare my prediction technique with their test results and their predictions. These are summarized in Table 4.

The first case is taken from Rolls Table I where the brake horsepower is observed on the test stand. I have used their observed fuel and air flow and manifold pressure and estimated the indicated efficiency at 0.9 of the theoretical value. The supercharger power is calculated from the Merlin XX portion of Chart 12 and uses the Rolls-Royce value for gear box efficiency of 0.95 (NACA used a much lower value of 0.85 in their performance analyses). Friction and pumping are from the Allison curves. Note that the pumping is zero, which explains why the original Rolls assumption about the mechanical efficiency remaining unchanged worked well on the test stand. If they had attempted to predict part load performance with this assumption their results would probably not have been consistent. My predicted brake horsepower for this case is 1,012 vs. 1,020 observed, a difference of less than 1%.

The second case is a comparison of my predicted results at 20,000 ft altitude with those of Rolls-Royce and Hawker. In this case my air flow is from Chart 4 while the Rolls value is from calibration as represented by Equation (4); I assume the same intake and exhaust manifold pressures as Rolls. My analysis predicts a larger brake power than Rolls because I predict a higher air flow, the supercharger horsepower is less and the pumping power is negative, which implies that some of the supercharger work is going back into the engine shaft, indicating that Rolls’ initial assumption about mechanical losses was not quite valid. My prediction is very close to that of Hawker but it probably would not be prudent to put too much significance in that result; suffice it to say that it is close enough to the other results that one can have some reasonable confidence that my approach is a valid one.

The differences in brake mean effective pressure and brake specific fuel consumption at a given intake manifold pressure, fuel/air ratio, and engine speed for the Merlin XX and the Allison V-1710 can be fully explained by the differences in their compression ratios and volumetric efficiencies, both working to the advantage of the V-1710. This conclusion was arrived at by cross plotting V-1710 data taken by the NACA [6] to get corresponding values in the Rolls report’s Table I. This result together with the good correlation obtained in the performance predictions justifies using the V-1710 friction and pumping characteristics for the Merlin XX and would also indicate that the V-1710 and MerlinXX superchargers had fairly comparable efficiencies.

To summarize: the assumptions made here are that the indicated efficiency is 90% of the theoretical Otto cycle efficiency and the friction and pumping characteristics of the Merlin XX are the same as the V-1710, which were measured on a motoring dynamometer. One could argue that a lower value for the indicated efficiency and lower friction would give the same result, but while a lower indicated efficiency is quite plausible, significantly lower friction is not, given the very similar designs and we have shown that the differences in bearing sizes and number of piston rings cancel each other (see Table 3). I have used the Merlin’s supercharger characteristics to calculate the power required to drive it so this is not an issue here.


Summary and Conclusions

Our analysis has shown that the volumetric efficiency of the V-1710 at 3,000 rpm was higher than that of the Merlin XX at intake manifold pressures higher than the exhaust pressure by an amount easily explained by the differences in manifold design, compression ratio, and valve overlap. We have shown that the Willans line approach to determining the Merlin’s friction and pumping losses at 3,000 rpm gives an implausibly high number for indicated horsepower but this does not impact on or invalidate the results of Rolls’ testing and analysis. These losses for the Merlin XX have been shown to be reasonably close to the measured friction and pumping of the Allison V-1710 as demonstrated by the good agreement between my predicted results and those of Rolls-Royce and Hawker.

The Merlin XX supercharger performance detailed in the 1941 report, when corrected for differences in testing techniques, would appear to be closer to Wright supercharger performance ca. 1943 than ca.1940 as claimed by Schlaifer.

Aside from laying the ground work for extremely impressive performance improvements this effort by Rolls-Royce probably was a watershed in engine performance testing and analysis at that time. The report itself is remarkably clear and comprehensive for an internal company document. Reading reports in the engineering literature from that era and before, one senses that most engine development was not as insightful or far-sighted as their work. The adoption of dimensional analysis in supercharger testing illustrates this change. The best that could be hoped for in the years leading up to World War II was a test where only one variable was changed at a time. Even in the work described here the analysis of the pumping loop was not thermodynamically rigorous but this oversight did not impact their results. They knew what needed to be varied and what held constant to make their technique work. Reading Schlaifer’s account of supercharger development in the 1930s gives one a sense of the crudeness that was prevalent throughout the industry. Some rigor was introduced by the NACA and their academic affiliates but the people that built and used the machines were mostly of the “cut and try” school of engineering. This is not to denigrate these organizations, “cut and try” is an art form in itself, one in which Rolls-Royce also excelled and cannot be replaced by any analytical techniques in engine design and development even today.

Notes and Comments

These notes are intended to point up some discrepancies and assumptions I found to be questionable in References [1] and [2]. Some appear to be simple copying errors while others are more fundamental. I offer them here in the spirit of getting this very important work as close to what the authors would have wished if they had my advantages of time and distance to go over their own work and refine it much more effectively than I could ever hope to.

I have already mentioned the lack of rigor in the analysis of the intake stroke and this is covered in the Air Flow / Volumetric Efficiency section of this paper. Another significant assumption made by the authors is that all of the fuel is evaporated between the carburetor and the supercharger inlet. Page 33 of Reference [1] contains the statement “both rig and engine tests confirm that the full 25°C reduction in inlet temperature is obtained before the eye of the supercharger”. Reference [5] gives data from a broad range of engines, both air and liquid cooled, that indicates that roughly 66% of the fuel is evaporated downstream of the supercharger. The many fuel distribution problems encountered with supercharged engines (think Wright R-3350) would indicate that the fuel is not fully vaporized until sometime after the intake valve closes. Given the difficulty of measuring temperatures in two phase flowing mixtures, I wonder how the tests they refer to were carried out. The experiments they refer to as carried out by Bridgeman were steady state tests where sufficient time is allowed to attain an equilibrium condition. My own experience in compressing wet steam has pointed out the importance of time in allowing a mixture to come to equilibrium despite what measured temperatures and pressures say it should be. I believe the same is true in a supercharger, the temperature at some point in the compression process may be such that all of the fuel would be vaporized if there were sufficient time, but there isn’t. In Figure 23 of Reference [1] reproduced in this paper as Chart 11, the supercharger intake pressure is given as 20.58 inHgA. The data presented in this figure should reproduce in Figure 27 where the parameter

is used instead of air flow but it doesn’t do so unless the intake pressure is increased to approximately 30 inHgA, which has led me to believe the 20.58 figure is a copy error.

I pointed out in Chart 1 of this paper that there is an inconsistency in the first line of Table I of Reference [1]. The value of SHP shown is not the sum of the BHP and S/CHP given in the table. Similarly the charge flow in the first line of the 9.49 ratio data is not the sum of the air and fuel flow.

The reference given on the bottom of the introductory page (iv) is probably to a paper by Pierce of Wright Aeronautical titled “Altitude and the Aircraft Engine”, which appeared in the journal referenced there. The Gagg and Farrar paper appeared in the June 1934 SAE Transactions. Reference [2], Appendix IV is Hooker’s summation of the work reported in Reference [1]. I have pointed out in this paper that he apparently sought to make the Merlin XX calibration technique more understandable by adding a friction term to his shaft power to get indicated horsepower and that his assumptions led to an unreasonably high indicated efficiency. This did not lead to a significant error since the unreasonably high friction number was subtracted back out whenever brake horsepower was estimated. I only mention this here once more to emphasize that his friction number does not represent the real friction and pumping losses of the Merlin XX at 3,000 rpm. Hooker also uses a supercharger gear box ratio of 9.29 on page 242 of Appendix IV. I have never seen this ratio in any other source. Did he mean 9.49? On another subject, the friction and pumping data for the Allison V-1710 is from Allison Test Report A2-7, NASM file D52.41/64 and was generously supplied to me by Dan Whitney. I have yet to get the full report from the National Air and Space Museum. The curves supplied by Dan give the same results as information in C.F. Taylor’s files in the M.I.T. Archives and in Figures 9.8 and 9.27 of Reference [4] where the engine is identified only as a V-12 aircraft engine of 5.5” bore and 6.0” stroke.

References

1. Hooker, S., Reed, H., and Yarker, A., The Performance of a Supercharged Aero Engine, Technical Series No. 3, Rolls-Royce Heritage Trust, P.O. Box 31, Derby, Great Britain, DE24 8BJ.
2. Hooker, Stanley (Sir), Not Much of an Engineer, SAE Press, 1984.
3. Raymond, R. J., “A Comparison of Sleeve Valve and Poppet Valve Aircraft Piston Engines “, April, 2005, Aircraft Engine Historical Society web site, www.enginehistory.org
4. Taylor, C.F., The Internal Combustion Engine in Theory and Practice, Vol. 1,
M.I.T. Press.
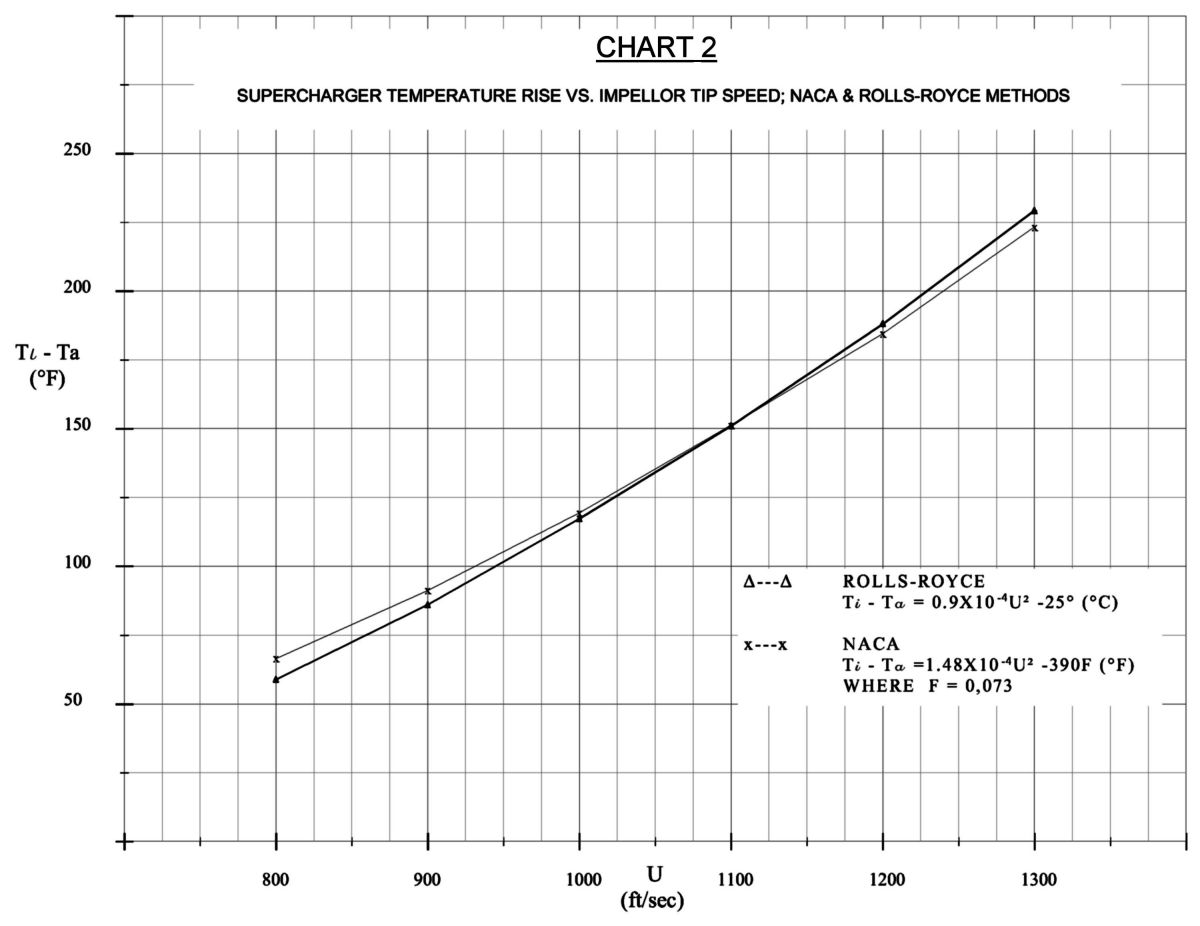
5. White, J.H., and Gammon, G.L., “Correlation of Mixture Temperature Data Obtained from Bare Intake-Manifold Thermocouples“, NACA MR No. E5L03, January, 1946.
6. Desmon, L.G., and Doyle, R.B., “Effect of Exhaust Pressure on the Performance of a 12-Cylinder Liquid Cooled Engine“, NACA TN 1367,
May 1947.
7. Taylor, et.al., “Dynamics of the Inlet System of a Four-Stroke Single-Cylinder Engine” , ASME Transactions 77, Oct., 1955, p.1133
8. Allison Test Report A2-7, NASM file D52.41/64. Figure 1, “Engine Friction & Air Horsepower, Allison V-1710 “F” Engine”

9. Bishop, I.N., “Effect of Design Variables on Friction and Economy”, SAE Paper 812A, Automotive Engineering Congress, Jan., 1964.
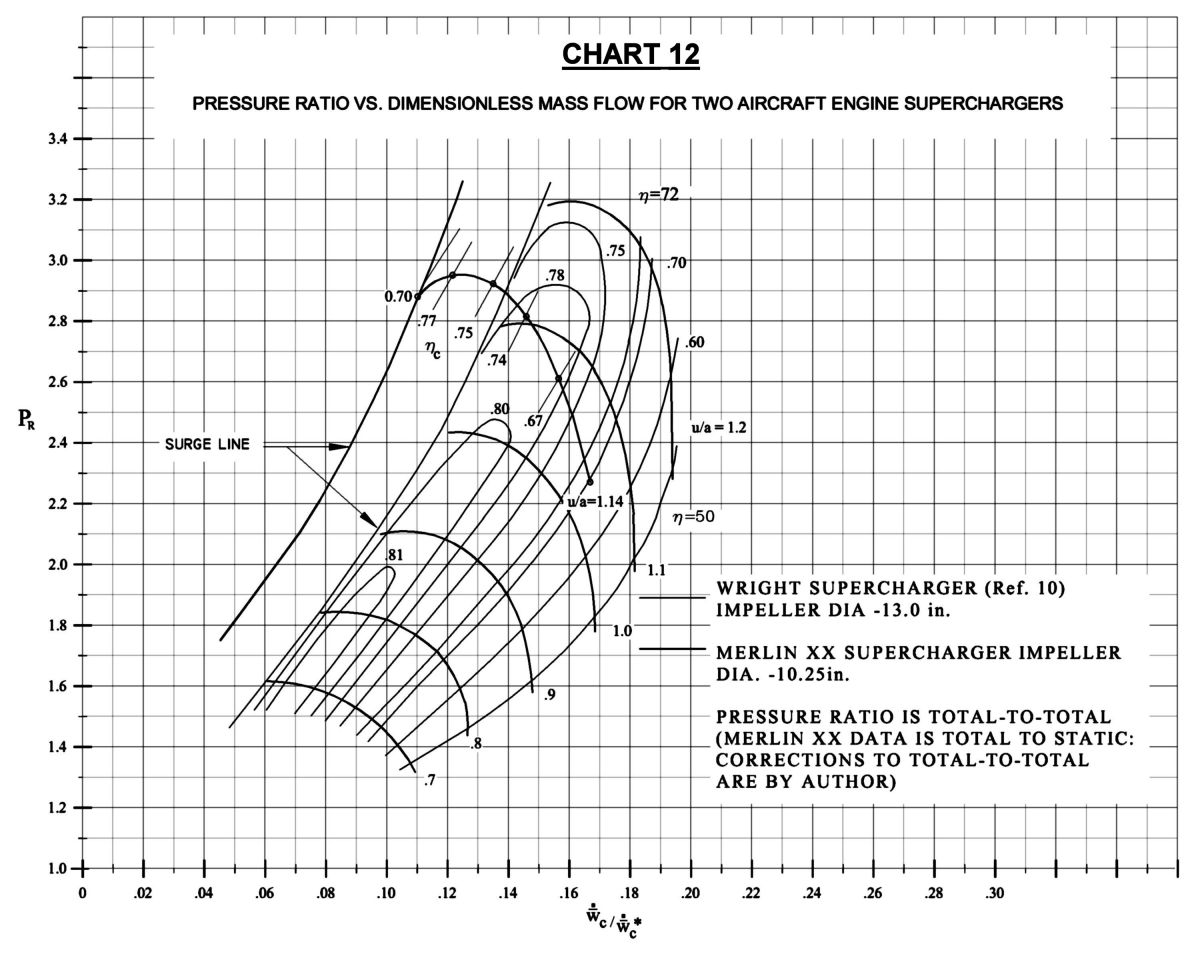
10. Campbell, K. and Talbot, J., “Some Advantages and Limitations of Centrifugal and Axial Compressors”, SAE Journal (Transactions),
Vol. 53, No. 10, Oct., 1945.
11. NACA Subcommittee on Supercharger Compressors, “Standard Procedures for Rating and Testing Centrifugal Compressors“,
NACA ARR No. E5 F13, June 13, 1945.
12. Schlaifer and Heron, Development of Aircraft Engines and Fuels, Harvard University Graduate School of Business Administration, Cambridge MA, 1950.
13. Reference 4, Figure 5-12.
14. Edson and Taylor, “The Limits of Engine Performance—Comparison of Actual and Theoretical Cycles “, Contained in SAE Publication TP-7, Digital Calculations of Engine Cycles, 1964.
 
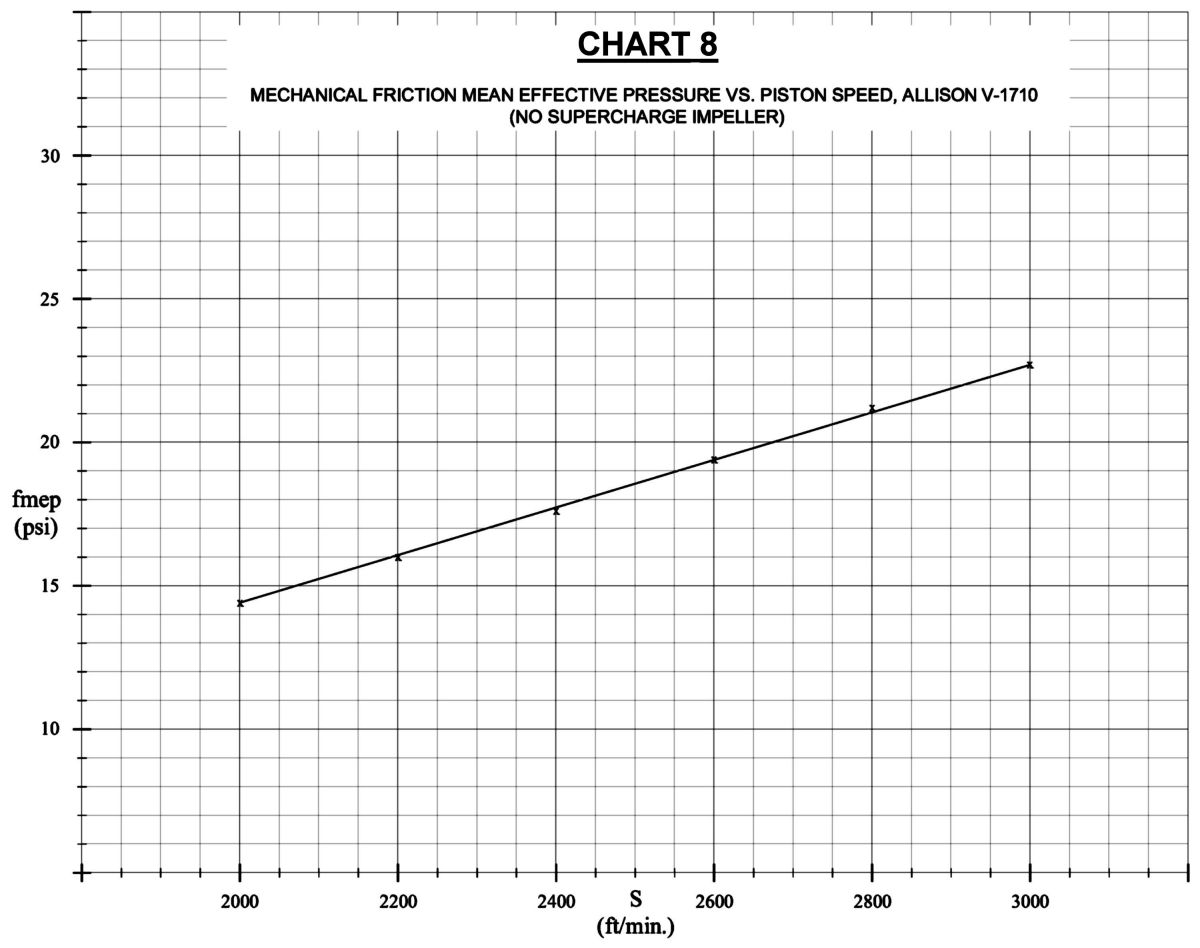
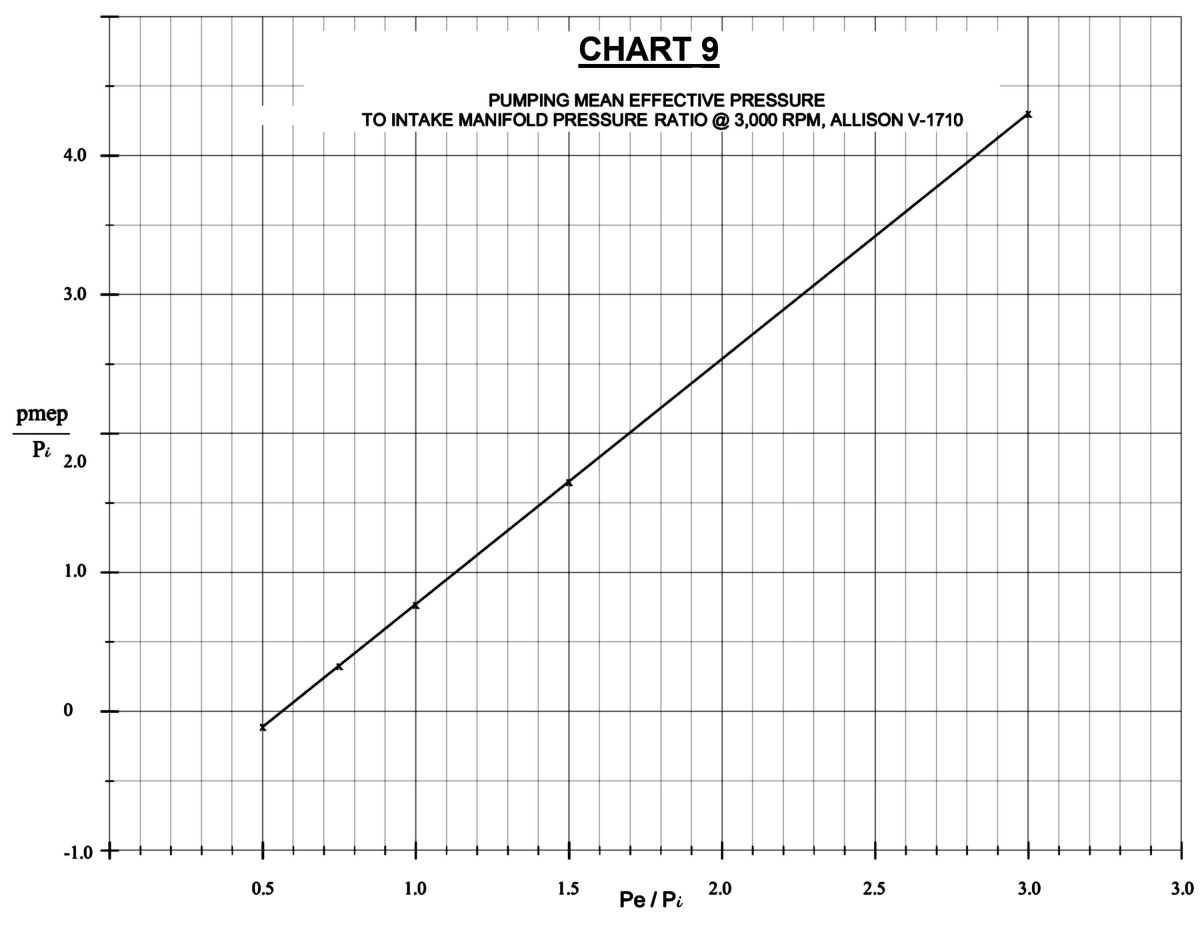
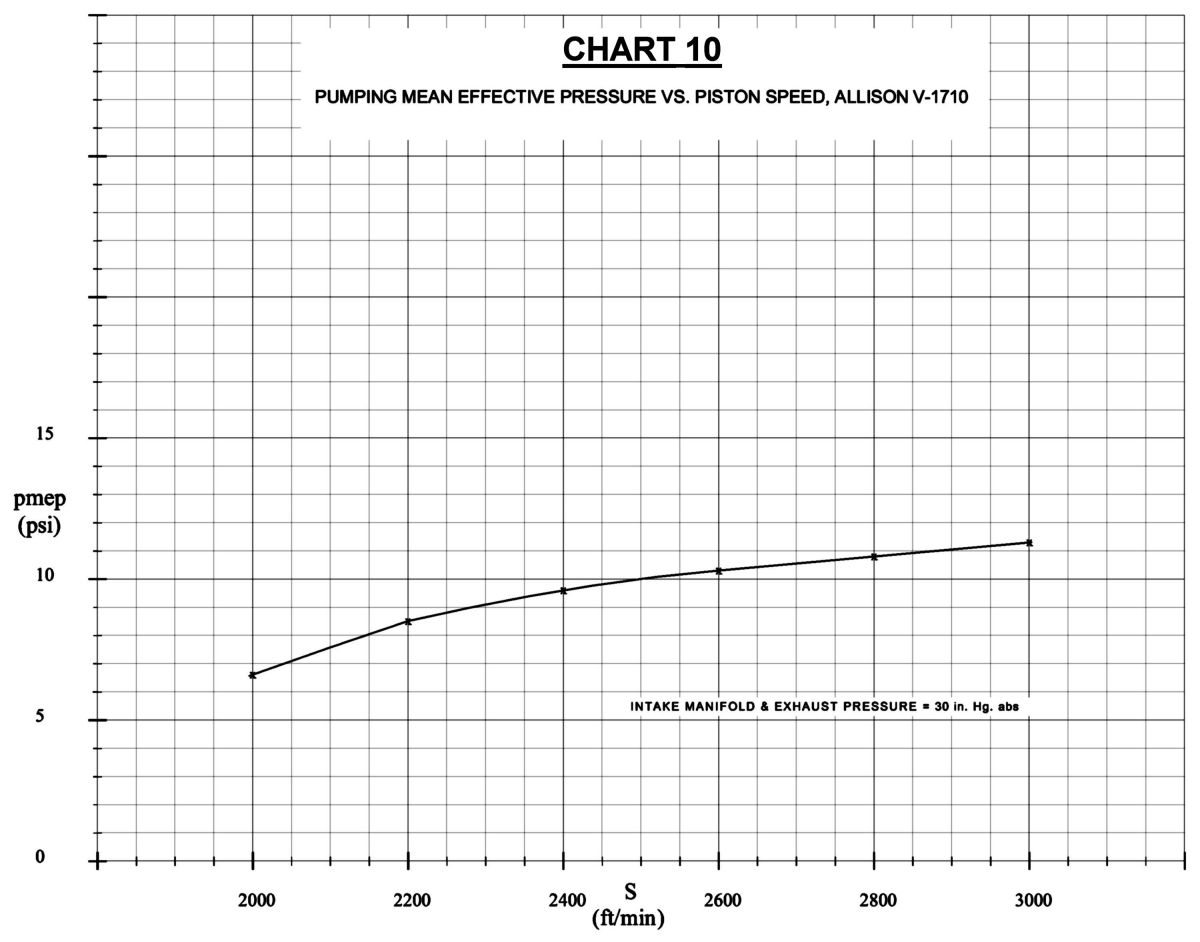
The method for calculating mean effective pressure is explained in the author’s earlier paper “Comparison of Sleeve and Poppet-Valve Aircraft Piston Engines.”


Note to Reader

The author welcomes comments. Please contact him via the webmaster.


Appendix A

Below is reproduced Table I from the The Performance of a Supercharged Aero Engine. Values for S/C H.P. are calculated from (Charge Flow) * (ΔT / 95), where
ΔT = 0.9 * ((Impeller Tip Speed)2 / 10,000).


Table I. (original)
Typical ObservedTest Results Showing Experimental Determination of
Shaft Horse PowerPer Pound of Charge.
Boost
"Hg. abs.
Air Flow
lb/min.
Fuel Flow
lb/min.
Air:Fuel
Ratio
Charge Flow
lb/min.
B.H.P.
Obs'd.
S/C.H.P.
 
S.H.P.
 
S.H.P./lb
of Charge.
MerlinXX M.S. Ratio (8.15:1) at 3000 R.P.M.
50.00137.210.0013.72147.20113216613188.97
45.02122.08.8513.75130.8599714711448.77
40.64108.67.9313.70116.5387813110098.65
36.3095.06.8513.90101.857651158808.65
32.2483.56.0713.7589.576311017328.28
25.9963.74.7013.6068.40432775097.45
20.0945.53.2613.9048.76222552775.68
MerlinXX F.S. Ratio (9.49:1) at 3000 R.P.M.
50.00129.29.4813.60142.68102021612368.67
43.93111.08.0513.80119.0586118110458.80
39.2597.27.2113.50104.417451599048.65
34.3584.36.1813.6590.486151387538.32
29.2968.95.0213.7373.924681135817.85
25.4561.24.5513.5065.753861004867.39
22.5049.83.6613.6053.16270813516.57
19.1640.33.0113.4543.31171662375.47


Table I. (corrected)
Same data as above but with arithmetic and precision errors corrected. Differences areshown in red but do not significantly affect conclusions.
Boost
"Hg. abs.
Air Flow
lb/min.
Fuel Flow
lb/min.
Air:Fuel
Ratio
Charge Flow
lb/min.
B.H.P.
Obs'd.
S/C.H.P.
 
S.H.P.
 
S.H.P./lb
of Charge.
MerlinXX M.S. Ratio (8.15:1) at 3000 R.P.M.
50.00137.210.0013.72147.201132 167 1299 8.82
45.02122.08.8513.75130.85997 148 1145 8.75
40.64108.67.9313.70116.53878 132 1010 8.67
36.3095.06.8513.90101.85765115880 8.64
32.2483.56.0713.7589.57631101732 8.17
25.9963.74.7013.6068.4043277509 7.44
20.0945.53.2613.9048.76222552775.68
MerlinXX F.S. Ratio (9.49:1) at 3000 R.P.M.
50.00129.29.4813.60 138.681020 213 1233 8.89
43.93111.08.0513.80119.05861 183 1044 8.77
39.2597.27.2113.50104.41745 160 905 8.67
34.3584.36.1813.6590.48615 139 754 8.33
29.2968.95.0213.7373.92468 114 582 7.87
25.4561.24.5513.5065.75386 101 487 7.41
22.5049.83.6613.60 53.46270 82 352 6.58
19.1640.33.0113.4543.31171 67 238 5.50


This website depends on cookies to make it function. If you continue to browse, scroll, click or otherwise interact, you are providing implicit acknowledgement of and agreement to this.
Copyright © 2002-2024 Aircraft Engine Historical Society, Inc.
      Home